About Screens

Home > User guide > About Screens
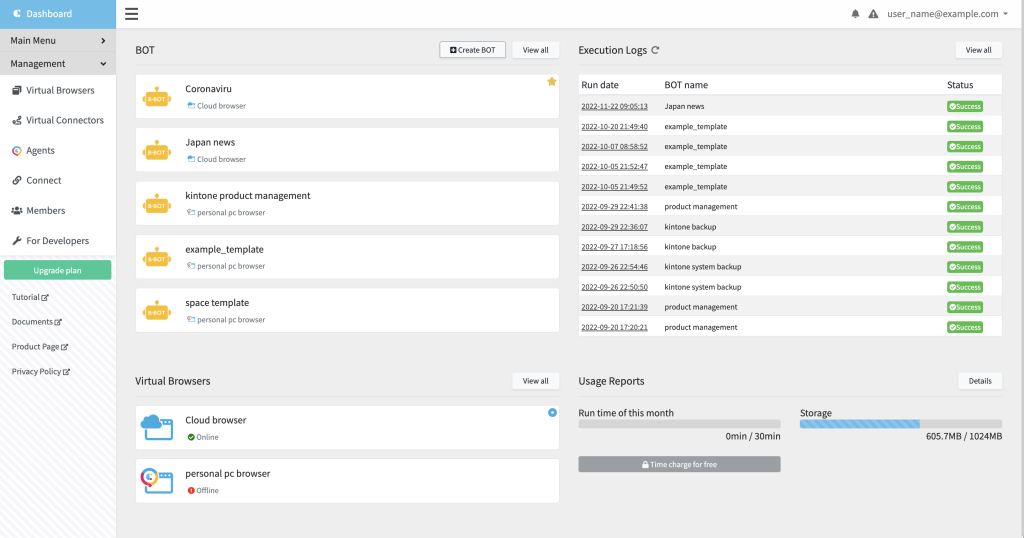
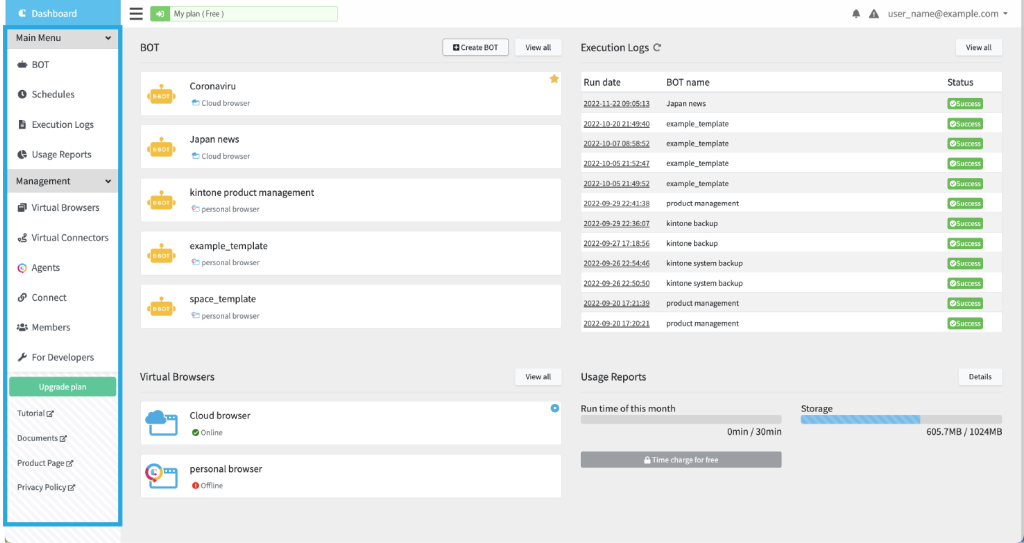
Dashboard
This is the first screen to transition from the login screen. In Dashboard, you can perform simple operations.
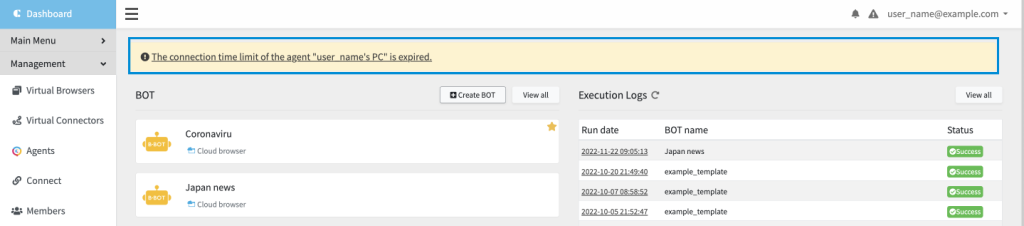
Alert
You will be alerted for Gateway extension notifications, maintenance work notifications, failure information, and more.
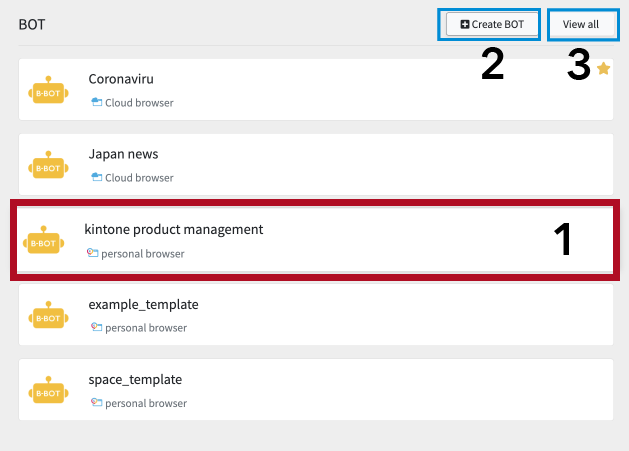
BOT
Recently created BOTs are displayed (up to 5 BOTs). BOTs set as favorites and those with the newer last run date are displayed preferentially. Here you can check the BOT icon and name. Bots set as favorites are marked with★
The following operations are available from this screen.
- Display the operation panel
- Create a BOT
- Show a BOT List
- Execute a BOT
- Edit a BOT
- BOT details
- Manage tags
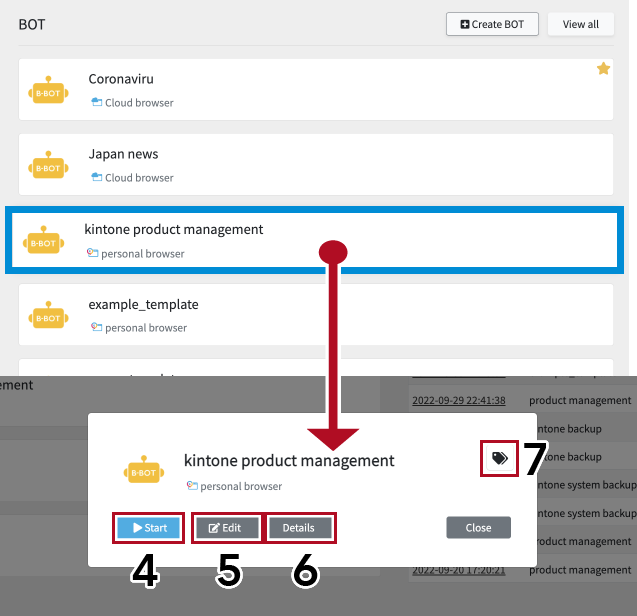
Display the operation panel
The operation panel is displayed when clicking a BOT.
Create a BOT
Clicking the [Create BOT] button creates new BOT.
Show a BOT List
Click the [More details] button to move to the BOT list page, which is transitioned from [Main Menu] > [BOT].
Execute a BOT
Clicking the [Start] button executes the BOT manually.
Edit a BOT
Clicking the [Edit] button edits the BOT.
BOT details
Transition the BOT details screen by clicking the [Details] button.
Manage tags
Click the icon to manage the BOT tags. Refer to “BOT tags” for details.
Execution Logs
Displays up to 12 execution logs per page. Execution logs are sorted by the last run date. You can check the run date, the BOT name, and the status.
The following operations are available from this screen.
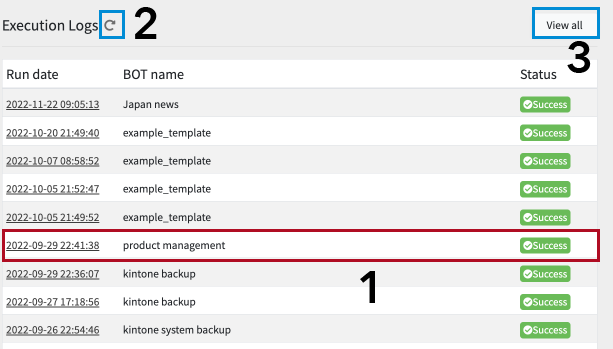
Confirm execution logs
Click the run date to display the Execution Logs details page.
Update execution logs
Click the icon to reload the execution logs.
Execution logs list
Transition the BOT details screen by clicking the [View all] button.
Usage Reports
You can check the storage usage status and this month's BOT execution time.
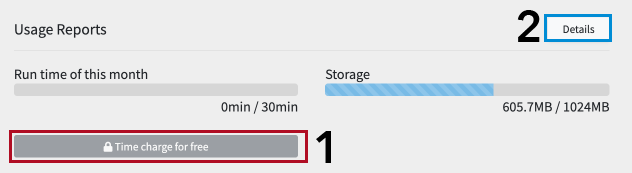
The following operations are available from this screen.
Free extension for BOT execution time (When the upper limit is reached)
When the BOT execution time reaches the upper limit, the [Time charge for free] button will be available. Clicking this button to extend the BOT execution time for 10 minutes.
Usage Reports Details
Moves to the [Main Menu] > [Usage Reports] page. You can view the usage reports details.
Virtual browsers
A list of created virtual browsers is displayed. Here you can see the virtual browser type, name and status. The default virtual browser is marked.
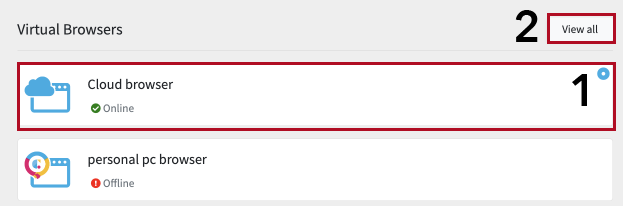
The following operations can be performed on this screen.
- Display the operation panel of the virtual browser
- Virtual browser list
- Open the virtual browser
- Virtual browser details
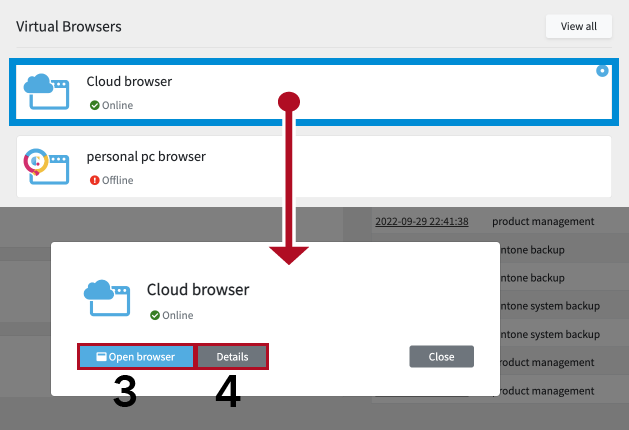
Display the operation panel of the virtual browser
Click the virtual browser to display the operation panel of the virtual browser.
Virtual browser list
Clicking the "View all" button, you can move to the virtual browser list page.
Open the virtual browser
Pressing the "Open browser" button, you can open the virtual browser.
Virtual browser details
Pressing the "Details" button, you can move to the virtual browser details page.
Global Menu
It is a guide menu to the main contents. Moves to the pages which belong to the Main Menu and the Settings/Management. Refer to respective pages about each contents.
You can fold the menu by pressing the caret.
Upgrade a Plan
Go To [Contract Info] > [Change plan] page. You can change your plan.
Documents
The document site will open in a separate window.
Product Page
The product page will open in a separate window.
Privacy Policy
Our privacy policy will open in a separate window.
Navigation Bar
The navigation bar at the top of the main screen, such as the dashboard, allows you to switch contracts and manage accounts.

You can open/close the global menu by pressing the leftmost hamburger button.
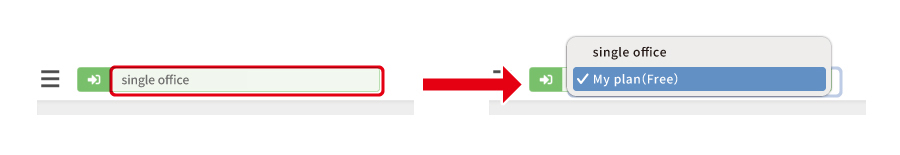
Switch the Contract
If you belong to another contract as a "member" (if your account has multiple contracts), you can switch between them using the navigation bar. Refer to "Members" for details.
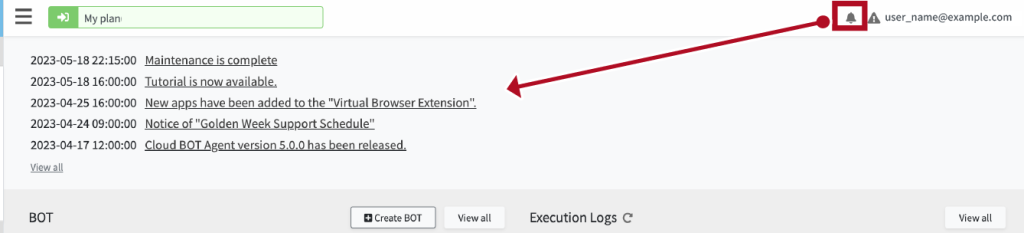
News
Click the icon to display up to 5 news. The ● badge on the icon indicates new arrivals. Click the [View all] button to display the news list page.
System Alerts
Click the icon to display up to 5 system alerts in the modal window. The ● badge on the icon indicates new arrivals. Click the [View all] button to display the system alert page.
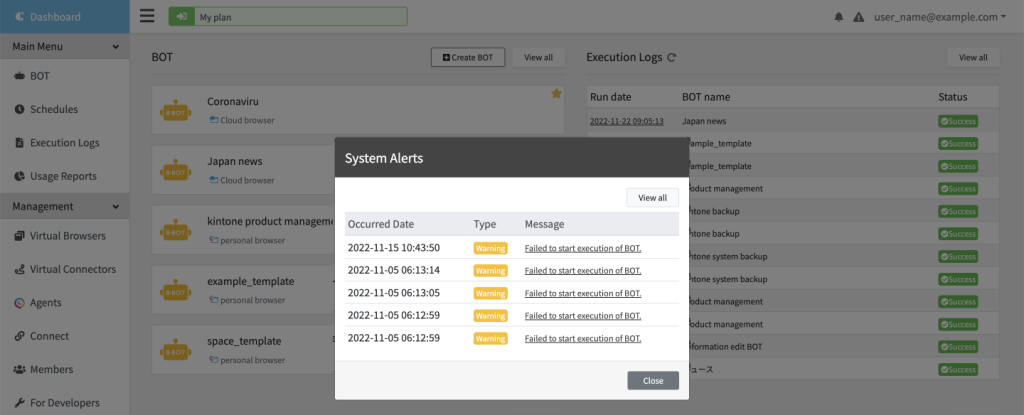
Alert List
| Type | Message | Details |
| Warning | Failed to start execution of BOT. | Displayed when the BOT fails to start execution. |
| Warning | Disabled event hook. | Displayed when an event hook fails and is disabled. |
| Warning | Failed to Mailhook(email notification). | Displayed when an email to the Mailhook callback destination is undelivered. |
| Warning | Failed to Webhook. | Displayed when a request to the Webhook callback destination fails. |
Account Management
The email address registered in the cloud BOT is displayed in the navigation. Clicking the email address to display menus such as account settings.
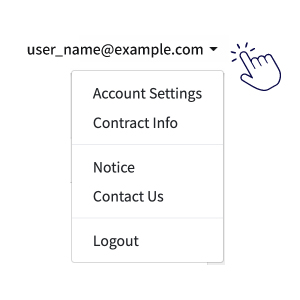
Account Settings
You can make settings such as Account, Security, Connected Apps, Access Token, and Account Deletion. Refer to this page about account settings.
Contract Information
You can see the contract information. You can change the plan and registration information. Refer to this page about setting the contract information such as changing your plan.
Notice
A notice list is displayed. It is the same as the page that transitions from the [More details] button on the dashboard.
Contact Us
The contact form is displayed. Enter the necessary items and click the [Send] button.
Logout
Log out from the service.